


Important facts about 'Fortune 500'
How much revenue, valuation, employee, profit etc

Let’s data dive
The Fortune 500 is like the VIP list of the business world, where the United States' largest and most powerful companies strut their stuff based on annual revenue. If companies were celebrities, the Fortune 500 would be the Hollywood Walk of Fame!

Employee:
The average number of employees across these Fortune 500 companies is around 60,815.
The company with the fewest employees has 381, while the company with the most employees boasts a whopping 2,100,000.
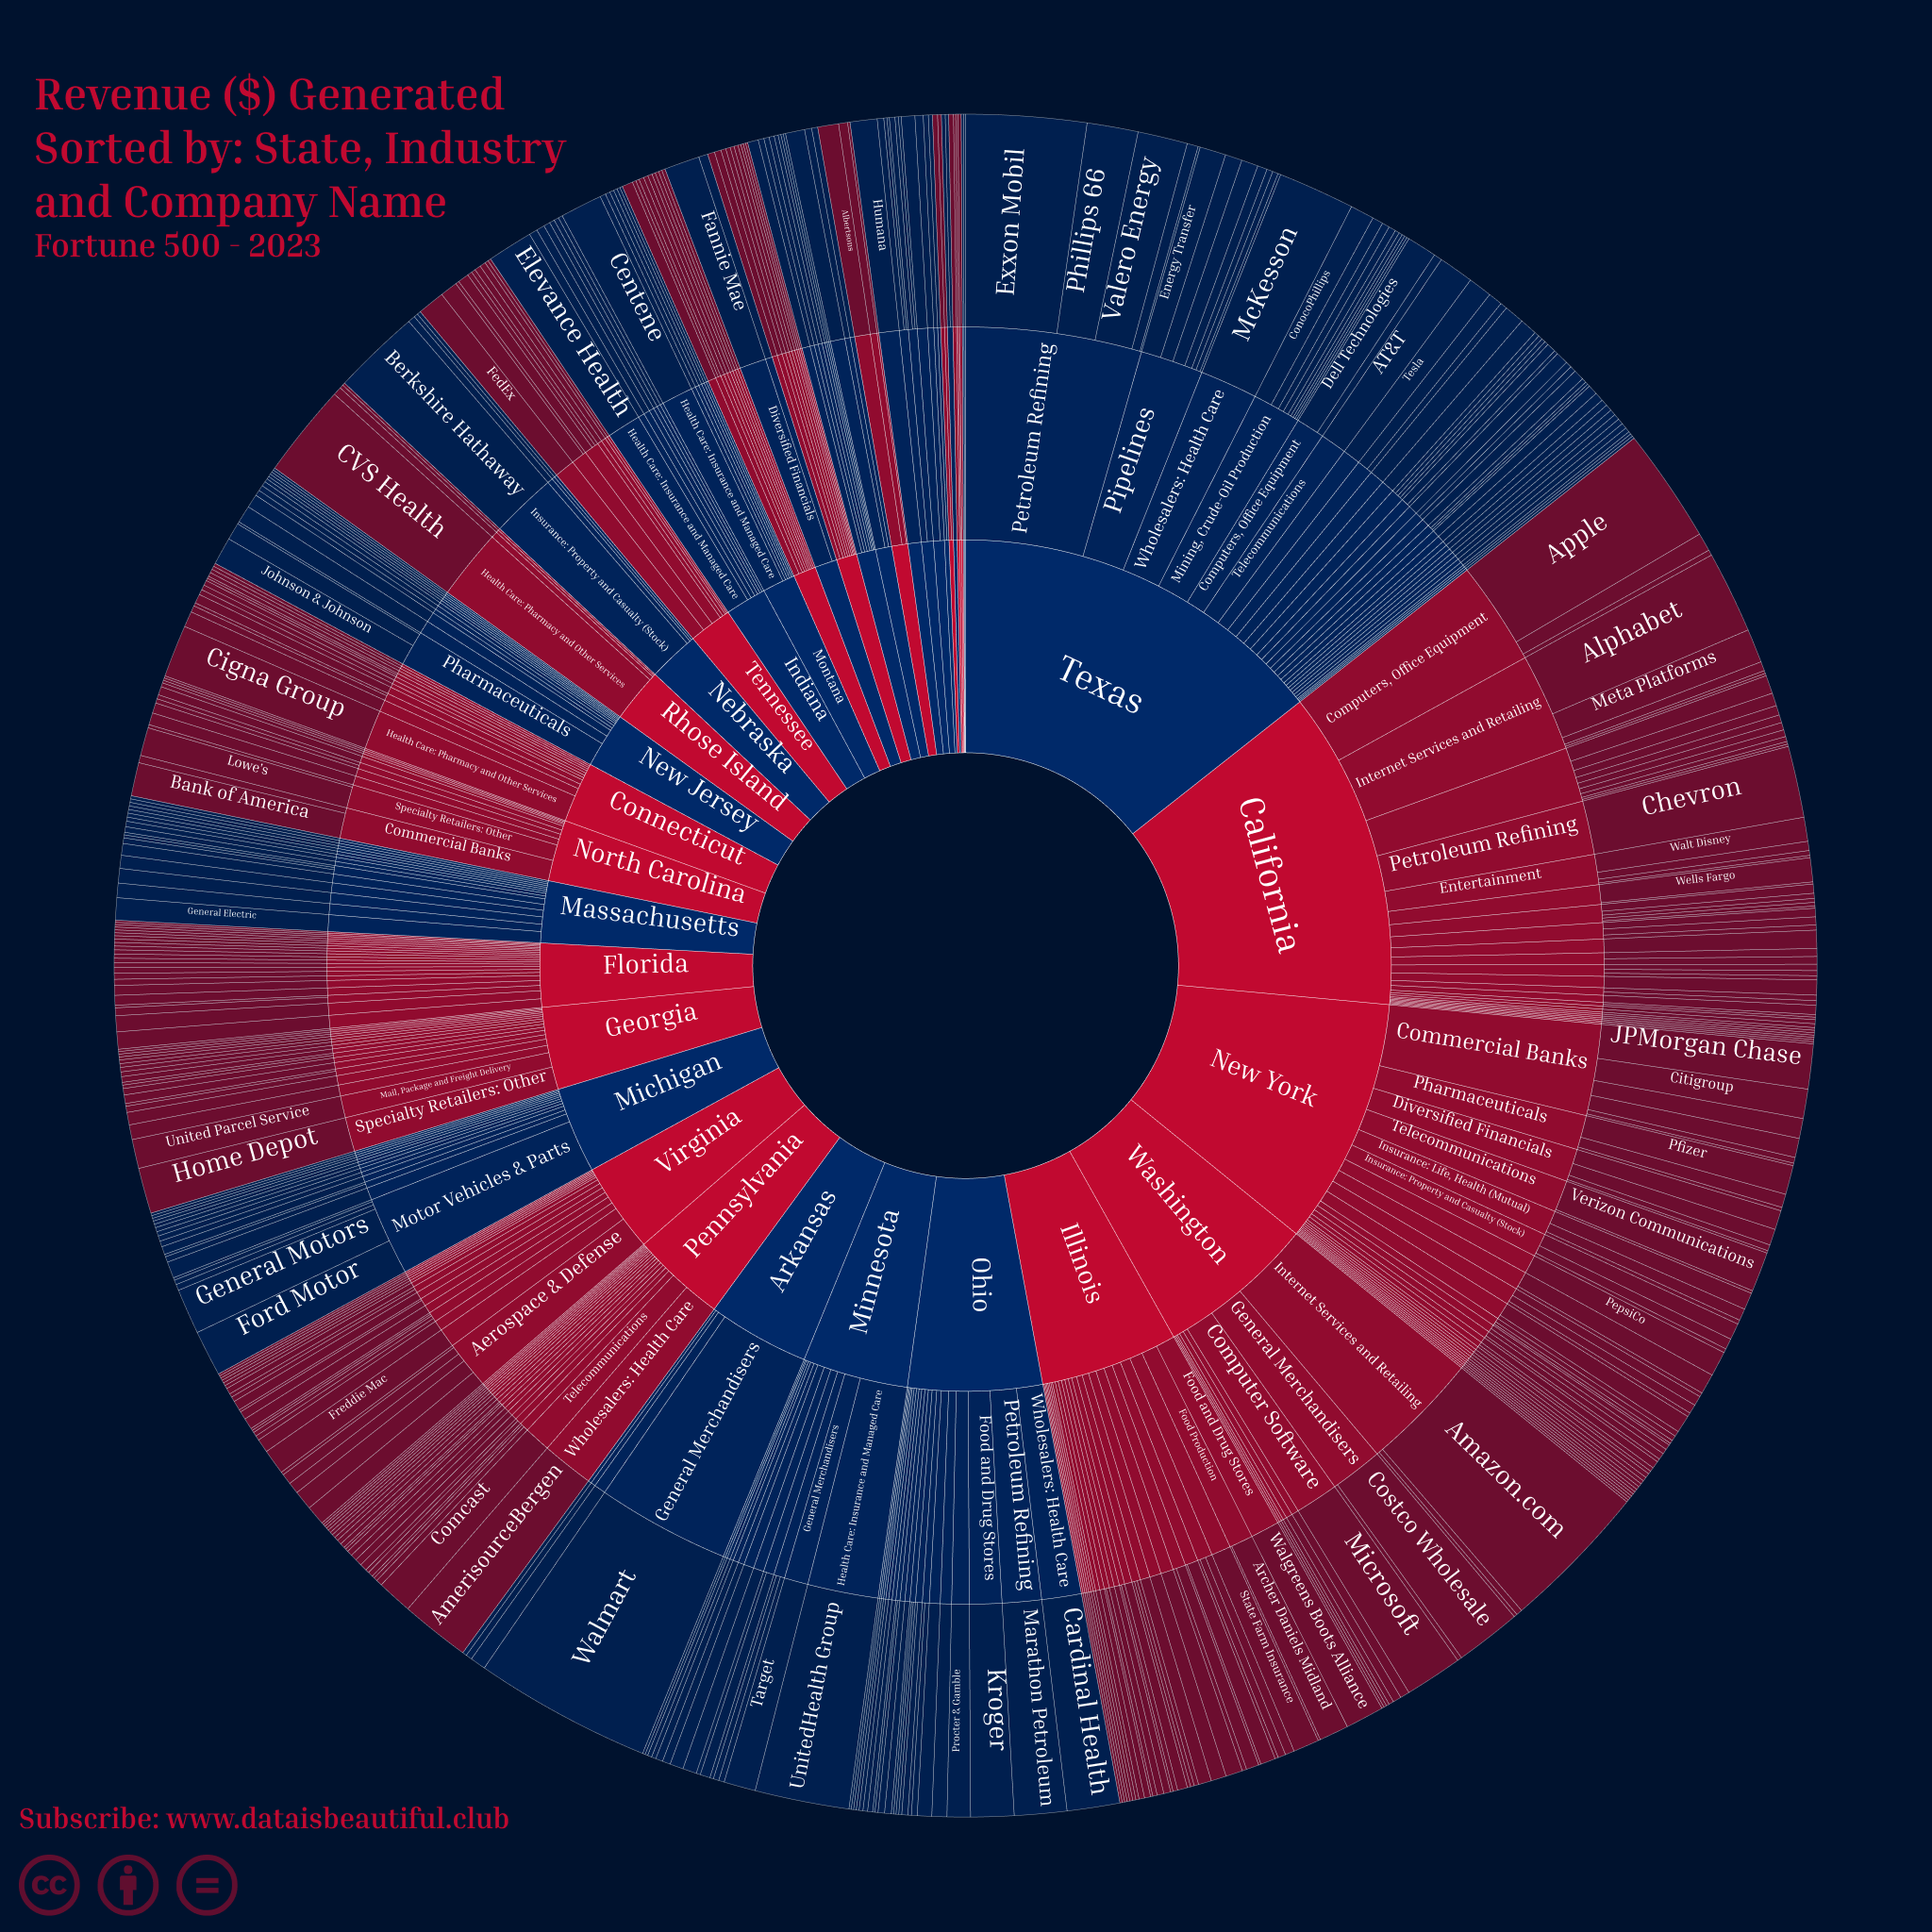
Revenue Mn:
The average revenue is approximately $36.29 billion.
The company with the lowest revenue earns $7.24 billion, while the top earner brings in $611.29 billion.
Valuation Mn:
The average valuation is approximately $69.70 billion.
The minimum valuation is surprisingly low at $54 million. The maximum valuation reaches $2.61 trillion.
Profit Mn:
The average profit is about $3.12 billion.
There's a significant spread in profit, with the least profitable company reporting a loss of $22.82 billion and the most profitable company earning $99.80 billion.
Profit %:
The average profit percentage is 9.39%.
The company with the lowest profit percentage had a negative value of -115.1%, indicating a loss, while the most profitable company had a profit margin of 51%.

Top 10 companies based on revenue, valuation, and profit.
By Revenue:
Walmart: $611.29 billion
Amazon.com: $513.98 billion
Exxon Mobil: $413.68 billion
Apple: $394.33 billion
UnitedHealth Group: $324.16 billion
CVS Health: $322.47 billion
Berkshire Hathaway: $302.09 billion
Alphabet: $282.84 billion
McKesson: $263.97 billion
Chevron: $246.25 billion
By Valuation:
Apple: $2.61 trillion
Microsoft: $2.15 trillion
Alphabet: $1.33 trillion
Amazon.com: $1.06 trillion
Nvidia: $686.09 billion
Berkshire Hathaway: $675.66 billion
Tesla: $656.43 billion
Meta Platforms: $549.48 billion
Johnson & Johnson: $483.58 billion
Visa: $475.31 billion

By Profit:
Apple: $99.80 billion
Microsoft: $72.74 billion
Alphabet: $59.97 billion
Exxon Mobil: $55.74 billion
JPMorgan Chase: $37.68 billion
Chevron: $35.47 billion
Pfizer: $31.37 billion
Bank of America: $27.53 billion
Meta Platforms: $23.20 billion
Verizon Communications: $21.26 billion

Top 10 industries based on average revenue, along with their average valuation and profit:
Health Care: Insurance and Managed Care
Average Revenue: $150.03 billion
Average Valuation: $132.21 billion
Average Profit: $6.19 billion
General Merchandisers
Average Revenue: $146.52 billion
Average Valuation: $102.03 billion
Average Profit: $3.17 billion
Petroleum Refining
Average Revenue: $144.38 billion
Average Valuation: $103.73 billion
Average Profit: $14.97 billion
Wholesalers: Health Care
Average Revenue: $141.30 billion
Average Valuation: $22.48 billion
Average Profit: $488 million
Health Care: Pharmacy and Other Services
Average Revenue: $108.43 billion
Average Valuation: $48.88 billion
Average Profit: $2.83 billion
Computers, Office Equipment
Average Revenue: $102.46 billion
Average Valuation: $450.56 billion
Average Profit: $17.98 billion
Mail, Package and Freight Delivery
Average Revenue: $96.93 billion
Average Valuation: $111.81 billion
Average Profit: $7.69 billion
Food and Drug Stores
Average Revenue: $86.47 billion
Average Valuation: $19.13 billion
Average Profit: $2.12 billion
Internet Services and Retailing
Average Revenue: $81.76 billion
Average Valuation: $251.53 billion
Average Profit: $5.39 billion
Telecommunications
Average Revenue: $68.12 billion
Average Valuation: $75.72 billion
Average Profit: $3.44 billion
Here are the top 10 states based on the number of Fortune 500 companies:
Texas: 55 companies
California: 53 companies
New York: 50 companies
Illinois: 33 companies
Virginia: 24 companies
Ohio: 24 companies
Pennsylvania: 23 companies
Florida: 23 companies
Georgia: 19 companies
Michigan: 18 companies
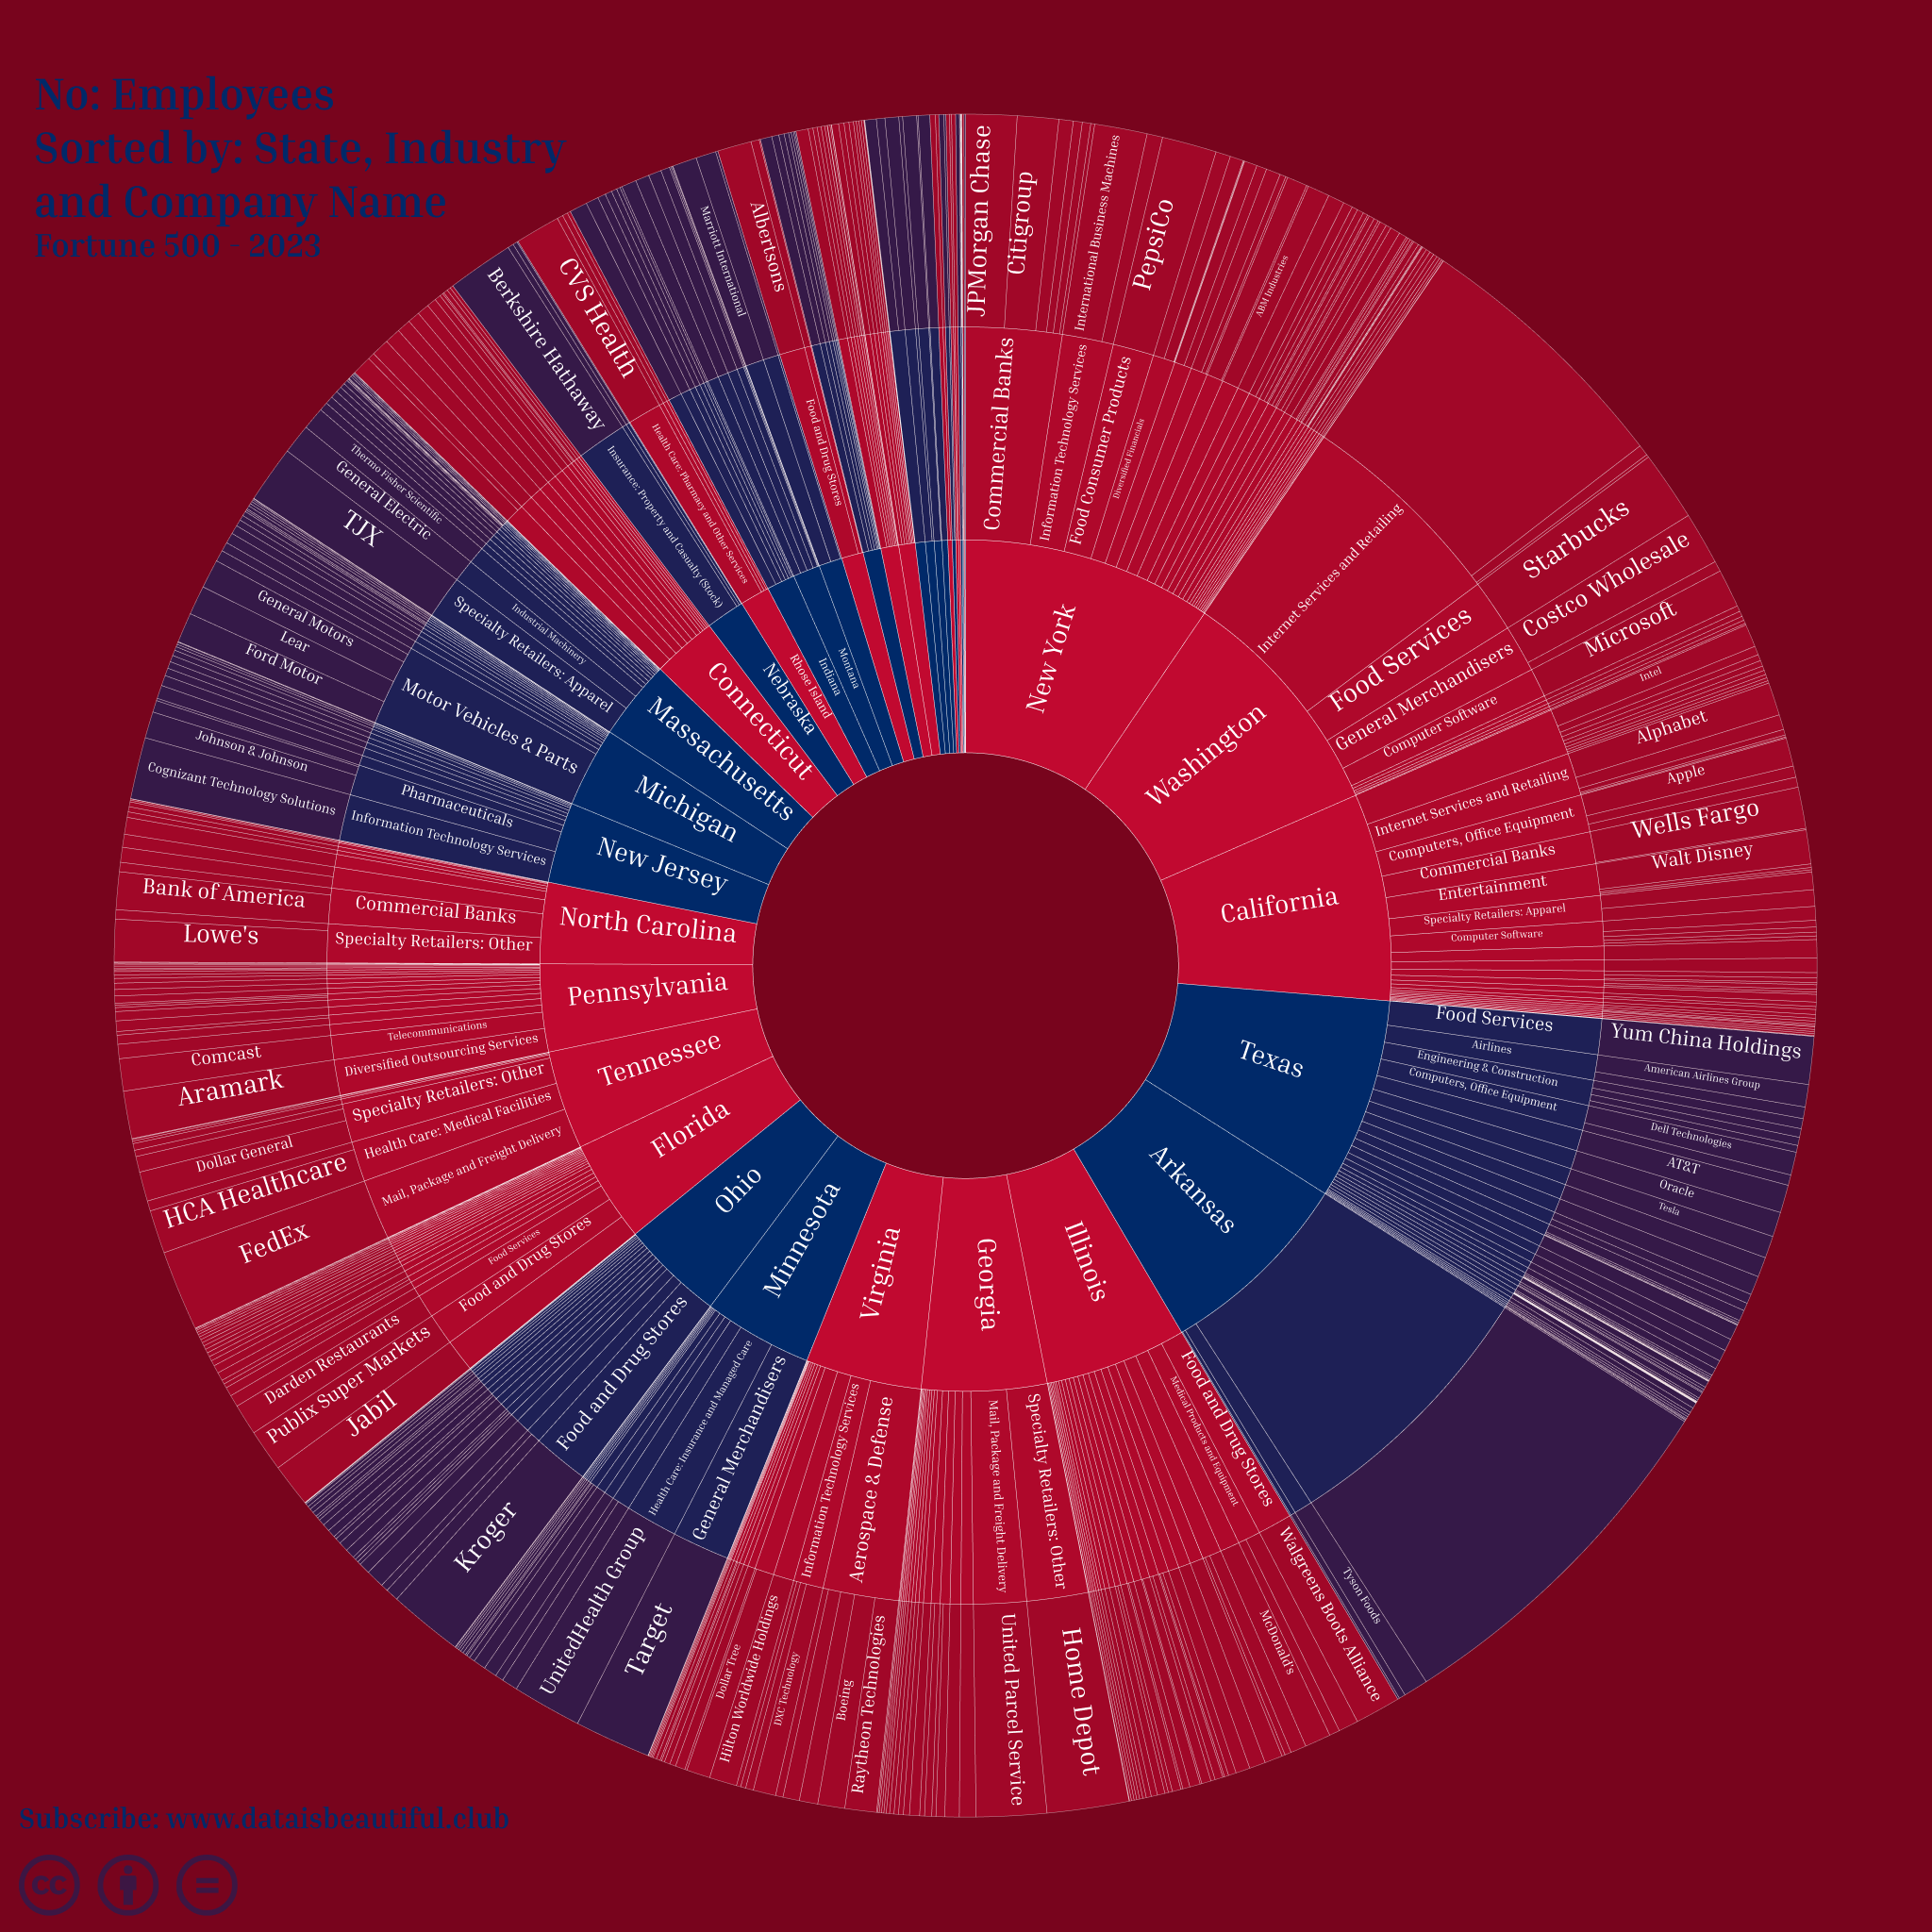
These states are major business hubs and have a high concentration of Fortune 500 companies.
Here's the correlation matrix for the numerical columns:
Employee and Revenue: There's a strong positive correlation of 0.69, indicating that companies with more employees tend to have higher revenue.
Revenue and Valuation: There's a positive correlation of 0.57, suggesting that companies with higher revenue often have a higher valuation.
Revenue and Profit: A positive correlation of 0.51 indicates that companies with higher revenue tend to have higher profits.
Valuation and Profit: There's a strong positive correlation of 0.79, meaning companies with higher valuations tend to have higher profits. This makes intuitive sense, as a company's valuation often reflects its profit-generating potential.
Profit and Profit %: A positive correlation of 0.41 shows that companies with higher absolute profits tend to have higher profit percentages.
It's interesting to note that while there's a strong correlation between the number of employees and revenue, the correlation between the number of employees and profit is not as strong. This may suggest that while larger companies (in terms of employees) often bring in higher revenue, their profit margins aren't necessarily proportionally higher.
Thanks for reading